
INSCYD view: A scientific analysis of Chris Froome’s Giro d’Italia performance
- Mark Turnbull

- May 20, 2020
- 16 min read
Shane Stokes (Cyclingtips) and Sebastian Weber (INSCYD)

The 2018 Giro d’Italia is fading in the rearview mirror, but debate continues to rage. Was Chris Froome’s stage 19 comeback plausible, or did it stretch credibility? Can we believe what we saw? Are comparisons to Floyd Landis’ ride in the 2006 Tour de France unfair, or are they reasonable?
Much of the debate has been emotive, based on gut reaction and feel. Power data released by Velon is incomplete, representing only the period around Froome’s initial acceleration and the moments that followed. Yet one sports scientist has sought to use those numbers to scrutinize the ride.
These figures were juxtaposed with the data from the lab test Froome did in August 2015, and which was subsequently released in a medical paper. Data from Froome’s Stage 14 win atop Monte Zoncolan was also used, as was data from his stage 20 defence of the maglia rosa.
A number of assumptions had to be made with the analysis, not least because of the limited data Velon published. However, as a physiological exercise, the approach by Sebastian Weber to analyse using the INSCYD metabolic analysis software is an interesting one and will add to the debate surrounding Froome’s unexpected victory at the Italian Grand Tour.
VELON DATA FROM THE GIRO
First off, the Velon data. In a press release issued the day after the end of the Giro, the company revealed the details of Froome’s Stage 19 attack. It said that his move came 10 kilometres into the Finestre climb, and averaged 397 watts of power on a 9.3% gradient for 3.02 kilometres. The time for the segment was 11 minutes 3 seconds and the average cadence was 95 rpm.
Velon didn’t release heart rate data, nor any other details.
As regards the Stage 14 data, Velon said that Froome’s attack to win on the Zoncolan “was built on a 1.3km attack in which he averaged 465 watts and 12.4km/h on a 15.4% gradient.”
It released more data from Stage 20, where Froome came under repeated attacks from Tom Dumoulin. Weber identified the three most important blocks of data. These were following Dumoulin’s attacks on the Cervinia climb, which was three minutes at 450W and 24.1km/h, a segment Velon called “thwarting attacks on the final climb,” which was 9:08 long with an average power of 420 watts and a maximum power of 760 watts.
See Froome’s Velon data from the Giro d’Italia here.

GETTING AN INSCYD VIEW
Sebastian Weber is a German sports scientist who previously worked with HTC-Highroad, Katusha, Lotto and Cannondale, and is an advisor to several sporting organizations such as the French swimming federation and Cycling Ireland.
The INSCYD system is currently used by Bora-hansgrohe and LottoNL-Jumbo, as well as coaches from other sports, and is a physiological analysis tool which draws on more than 150 scientific studies to break down athletic performance. Its functions include calculating an athlete’s particular “engine,” including what their physiology and fitness level should enable them to do, as well as the mix of fuel sources they use to do work.
Lab tests can be used to create a model for each rider. So too field tests: By gathering and combining data such as power measurement, heart rate and lactate levels, it is possible to create the same model for a rider. This can be used to design training programs, and can also be tracked over time to trace improvements and to highlight areas which need work.
Importantly, the model created for a rider can also predict what they should be capable of doing. Thus, the exercise to compare the virtual Froome from 2015 with what he did in the 2018 Giro.
FROOME’S 2015 LAB TEST DATA
Three weeks after Froome’s second Tour de France victory, the Briton voluntarily underwent a lab test on August 17 at the GlaxoSmithKline Human Performance Lab in Brentford, London. He was examined by GSK senior sports scientists Phillip Bell and Matt Furber, as well as the lab’s director of research and development, Ken van Someren.
The testing was observed by Jeroen Swart, a sports physician and exercise physiologist at the University of Cape Town who is also part of South Africa’s doping control review commission.
The information gathered was used to write a scientific paper entitled The Physiological Profile of a Multiple Tour de France Winning Cyclist, which appeared in the peer-reviewed journal Medicine & Science in Sports & Exercise in early 2017.
Weber drew on this data to build a physiological profile of Froome. He explained to CyclingTips how he did this: “We went back over his lab test. We have a measurement of his VO2max, we have some lactate levels in there. We have some bodyweight and body composition/body fat measurements. We also had gross efficiency measurements, changes under different environmental conditions, and lactate concentrations at a given power output and time duration during the lab test. We used all those metrics to build a physiological model.”
Weber did have some issues with the lab test, believing that adjustments needed to be made. “There is a VO2max reading which is stated to be 84 ml/min/kg. But when you put this in perspective with the other metrics – gross efficiency, body composition, power output at the end of the ramp test, lactate values, etc, the data doesn’t line up perfectly. His functional VO2max is more likely a shade lower, something like 1.5-2.5 ml/min/kg less.
“But this said, the difference is in the normal range of error of measurement. And even in the paper the author states the coefficient of variation in the metabolic cart was 1.8%, but only tested up to 3.94 l/min. Well, Froome’s test was 5.91 l/min, so well above this range. Furthermore, at maximum effort, you might see higher VO2 measurements because of active muscle mass in the upper body. Long story short, in our calculations, we used 82.2 ml/min/kg as a ‘functional VO2max’ because it fit better with all the other metrics.”
Chris Froome en route to stage victory atop the Zoncolan on stage 14 of this year’s Giro d’Italia.

Before explaining what he did next with these corrected lab test results, Weber gave his analysis of that 2015 test, plus a theory on why he believes Froome has been so successful in three-week races. “It is an outstanding high performance, but there is nothing so different from his rivals,” he said. “No offence, but there is nothing super special compared to them; it is like if you look at Chris’ performances in a one-day race.
“He has a physical capacity similar to other GC contenders. If that was not the case, then he would not sit in the same group as them most of the time, and he would ride away every stage. But he is on par with his competition. He is maybe a tiny bit better. Maybe he is just more stable.”
This consistency is, he believes, what adds up over a Grand Tour. “His success is more about being able to not have volatility, to not have fluctuations in his performance, I think. It is more about being able to have these numbers for a constant three weeks. Look at Simon Yates. Maybe he had better numbers starting the Giro, but obviously, he has had a big fluctuation.”
BUILDING THE FROOME MODEL TO ANALYSE THE GIRO PERFORMANCE
Weber and the coaches of Bora-hansgrohe and LottoNL-Jumbo, as well as coaches from other Olympic sports, have been using the INSYCD software to project what is possible from their athletes. Importing raw material enables a characteristic profile to be built of each sportsperson; among the information it calculates is the fuel sources athletes use. Given that the body’s stores of glycogen are limited, but body fat is not, the fuel analysis combined with power data can help tell how hard an athlete can go and for how long.
“Once we have data, what we can do is put those pieces together,” Weber said. “We can take the physiological profile of a rider and then project any kind of load, so to speak, on it. Either we can put in raw data from a power meter or any other tracking device or, in this case, we can say it is a constant 397 watts for 11 minutes [the Velon data from Stage 19].
“Then you can see what is happening in the metabolism in order to achieve that power for this amount of time. When you do this, you always have an idea of how it is done and if it can be done.”
However, Weber didn’t use only the corrected 2015 lab data as is. He made further corrections to take account for the fact that Froome’s Giro efforts were in the middle and end of a tough stage race.
“We took the corrected VO2 Max reading of 82.2 and then, for the analyses of the limits of what is possible, we used a value 5% lower that this, 78.1,” Weber said. “The reason why we used a significant lower VO2 max was for a number of reasons. It would take account for him perhaps not being at his best performance for Stage 14 or, for Stage 19, because it was in the third week of a Grand Tour, and at altitude.
“Also we were able to calculate his glycolytic power (called VLamax), which should have been exactly at 0.3 mmol/l/s at the time of test. We also lowered this to 0.25 (in combination with the lowered VO2max) to see if the performance was still doable.
“For me, this is a general margin to say ‘look, we took some percentages off to be on the safe side,’ so to speak.”
Weber inputted various weights to test his theory, at first going for 66.5 kg, an average of Froome’s 2015 Dauphiné weight (66kg) and his 2015 Tour weight (67kg). But, given that some said Froome was heavier in this year’s Giro, he ultimately settled on a weight of 67.5 kg.
He used various other factors from the 2015 lab test, including his power at 2 mmol and 4 mmol lactate, and incorporated the 525 watts that was Froome’s maximum at the end of the ramp test.
Then he inputted the data from Stage 14, Stage 19 and Stage 20 to see if what Froome did was plausible.
THE ANALYSIS
Working off a 2015 lab test and applying it to performances three years later is not an ideal scenario. So too is using partial power data from Stages 14, 19 and 20; had Froome, or Velon, released more data, a more complete picture could have been built. Weber believes he had enough data to make an interesting analysis of Froome’s two big Giro attacks plus his defence.
Before we get to that, what was Weber’s motivation?
“By chance, I read an article [on Froome’s stage 19 solo move] during my lunch break, something like 30 minutes after it came out, and there were already about 20 comments in the comments section. They said, ‘that’s not true [the performance], it can’t be true.’ So this is why I wanted to dive in and see, to look behind and see if this can or cannot be true.”
Weber initially looked at Froome’s 80km solo attack on Stage 19. He broke down the initial effort made to get and built the early gap. “We are talking about this 11 minutes and three seconds. We don’t have any idea what he did to stay away to the finish, because we don’t have the power numbers from that. But in terms of what he did to pull away, that is something we can look at.
“We only have one power number, we only have the average. It is an important point to say that we don’t know if he accelerated with 400 watts, 450 or even 600…so we don’t know the kinetics of the power. This is something that changes the picture, if you look into the detail, if it is an unsteady power output.
“What it changes is especially when we start to talk about how much of the energy comes from the aerobic system and stuff like that, then we are a little bit off. Because the first 10 seconds, 20 seconds, 30 seconds in the acceleration phase we kind of underestimate or overestimate because we don’t know how hard he accelerated.
“If we had the data, it would be very interesting, because this acceleration phase could tell us something about how much anaerobic energy he needed to invest. But I wouldn’t say this makes things less accurate; just simplified. I would say you are smoothing the data very much. It doesn’t change the whole picture, it doesn’t make the whole analysis less accurate. It oversimplifies things, so to speak.”
Weber composed graphs to show the energy breakdown of the acceleration.
“The graph shows that Chris Froome uses some creatine phosphate to accelerate and then because we can assume very quick oxygen kinetics, a very quick adaptation of his aerobic metabolism because he is such a well-trained endurance athlete. He then covers 95 percent, 94 percent of the energy aerobically.”

This graph shows the likely energy sources during the effort on stage 19. Red = breakdown of creatine phosphate, green= glycolysis (anaerobic energy from glucose), blue = aerobic metabolism. Note: due to the lack of an actual data file, this is based on a simplified power profile containing a 20-second acceleration phase followed by a steady effort afterwards, at a 397 watt average.
“If you take a solid 5% off his VO2max value – because of fatigue, altitude, because he isn’t as fit, etc — and take 17% of his glycolytic capacity, which I think is a fair estimate in the third week of a GC, then in this case the scenario on stage 19, the 11 minutes and three seconds at 397 watts, becomes an effort which is severe exercise, which would put the rider under the risk that if he gets caught that he can’t stay with the group.
“It is possible for sure, but it gets closer to fatigue and it seems risky. But if you take only 3% or 4% off his VO2max, not 5%, he is back in the ‘green zone.’ His pH levels are not going down, he doesn’t have acidosis in the muscle, he is not depleting his energy system to an extent where it is close to being impossible.”
To simplify things: Under the scenario where Froome’s third week performance in the Giro is assumed to be 4% or less off what he reached in the already “corrected” 2015 lab test, something Weber believes is realistic, he sees the acceleration and initial time-building documented by Velon as being feasible.
“We can prove that his VO2 during this attack is approximately 82 percent of his VO2 max,” says Weber. “And his muscular lactate values are more in the range of, let’s say, three to four. So nothing too crazy. And we can say that he covers almost 95 percent of his effort aerobically. Therefore we can say that it is pretty sure that this is possible.”

How the effort of 11:03 at 397W on Stage 19 was likely created: Approximately 94% of the needed energy would have come from aerobic energy metabolism, only about 6% came from anaerobic energy metabolism. This required an oxidation uptake of approximately 67 ml/min/kg, which is approximately 82% of VO2max. During the effort approximately 4.8 mmol of lactate would have been accumulated.
Weber also considered Froome’s solo effort to win atop Monte Zoncolan on Stage 14. It turns out that similar conclusions can be drawn there. “Basically what I did was I ran the effort of Stage 14 at the same physiological numbers as we did for stage 19,” he said. “And what we can see this effort is an all-out effort. It is not an easy one, it is pretty tough, but it is still doable.

How the effort of 6:17 at 465W to win Stage 14 was likely created: Almost 89% (88.7%) of the needed energy would have come from aerobic energy metabolism, only 11% came from anaerobic energy metabolism. The required an oxidation uptake of approximately 74 ml/min/kg, which is almost 90% of VO2max. During the effort approximately 4.8 mmol of lactate would have been accumulated.
“What I feel really strong about is that the one effort validates the other. It is not like you need to change the profile of the rider. We create one profile which then fits for both scenarios, which can explain both efforts. So both of these efforts are plausible in light of his earlier lab test.”
Finally, Weber looked at Stage 20, where Froome was repeatedly attacked by his rivals.

“I used the part where he followed Dumoulin, which is three minutes at 450 watts,” he said. “And I looked at the sprint to the line – 20 seconds at 510 watts, maxing 900 watts. This is useful, because it contains two figures, a maximum and the average, and it is nice because it is short. This speaks mainly about the anaerobic metabolism, and therefore it provides a little bit more validation on this part.
“However, as you might imagine, a sprint depends vastly on what you did before the sprint. Was he coasting, or was he already ‘en bloc,’ so to speak? But it is nice because it is a completely different time duration, so it makes sense.”
The third block of data he felt was most relevant from that stage was the one where Froome was fending off attacks on the final climb. This included the Dumoulin surge, but also much more of the climb. “This was the one of 9:08 at 420 watts. It also includes the peak power, so it has some more data to it.”

How it was possible to cover Dumoulin’s attacks on Stage 20: Approximately 86% of the needed energy would have come from aerobic energy metabolism, only about 14% came from anaerobic energy metabolism. This required an oxidation uptake of approximately 70 ml/min/kg, which is approximately 86% of VO2max. During the effort approximately 2.3 mmol of lactate would have been accumulated.
Looking at those, he said the same pattern emerged. “With the corrected lab test, considering our lower limit of five percent, we can see that following Dumoulin is difficult… it is not impossible, but you can see it is a severe exercise. And the whole 9:08 segment is also a little bit harder, because it sounds to me it is repeating attacks with changes in rhythm. It seems not to be a steady effort.
“This is all on Stage 20, the day after his long solo. I find it interesting because if you go somewhere in the range of the corrected lab test minus four percent, following Dumoulin is in the green zone.”
Simply put, Weber believes the athlete who did the 2015 lab test was also capable of the data Velon released from Stages 14, 19 and 20. But that does depend on Froome being just four or – possibly – five percent off the adjusted, slightly down-scaled lab test. And for the data on stages 19 and 20, being at this level at the end of a three-week race.


Comparison of the energy sources during the efforts of Stage 14 vs. Stage 19 vs. Stage 20: In the shorter effort on Stage 14 a bit more than 11% came from anaerobic metabolism, most likely. Covering Dumoulin’s attacks on Stage 20 was a similar power, but a shorter segment resulting in a similar contribution (14% anaerobic, 86% aerobic). In comparison, in the longer effort on Stage 19 it was only half of the anaerobic effort (5.7%).
AN 80KM TIME TRIAL
Of course, this leaves out the most striking part about the race, namely Froome’s big attack on stage 19. Froome’s effort there wasn’t only about the 397 watts of power averaged over 11 minutes 3 seconds. In fact, that represented just 3.02 kilometres of Froome’s solo move, leaving over 70 kilometres without any released power data.
Weber says there is a resulting limitation on the analysis for that day.
“We didn’t look at the whole stage because we didn’t have that information. Aside from the Velon segment of 3.02 kilometres, which ended approximately 3.6 kilometres from the summit, what we can say is that he should be able to hold a similar power output to the top of that climb.
“We can see from the analysis we did that there is not so much fatigue. He is not digging himself into a big hole. This indicates that he most likely would have been able to keep the same effort for longer. Whether he did that, or if he faded by 10 watts, I don’t know. But in theory a similar effort to the top or going over the climb would not be an issue.”
Beyond that, it’s impossible to analyse the performance between there and the finish. “As regards what happened afterwards, in relation to how much time he gained on the downhill, how much time he gained cornering, how much time he gained climbing, I don’t know. But certainly he could have kept going in a similar effort for a longer time.”
Without more data, though, it’s impossible to tell how long.
Ideal case scenario, what would Weber need to be able to validate the Stage 19 ride?
“I think the first thing you would need is his whole power recording of the entire 80km breakaway,” he said. “Because then you can see if there is one segment where there is a power output which doesn’t fit the picture. That is maybe the best validation.
“If there is a segment which raises an eyebrow, you can calculate further… Let’s say there is a five-minute effort where our corrected lab test minus four percent cannot explain it any more. Then we would need to go back and say, ‘okay, what is the minimum requirement for this effort?’ and then see what is the outcome of that.
“If you see the minimum requirement for this other segment is the corrected lab test minus two percent, then it may still be possible. But if it is the corrected lab test plus 15 percent, then you would go, ‘woah, wait a second…’
Of course all of this is conjecture. Without the remaining data, it’s impossible for Weber to assess the full block of time where Froome won the Giro d’Italia. What he will say, though, is that taking the 2015 lab test into account, he feels the Stage 14, Stage 19 and Stage 20 data published by Velon fits the virtual Froome model he built using the INSCYD software. That gives him reassurance that the released power data was feasible, and doesn’t cause alarm bells to ring for him in relation to that data.

The limits of the possible in the winning effort of Stage 14: Based on the corrected lab test data (left side) the effort of 6:17 is a severe exercise showing several system of fatigue, but not to exhaustion before the end of the effort. Reducing the physiological capacities (right side) by 5% (aerobic system) / 17% (glycolytic system), the effort would lead to exhaustion before completion.
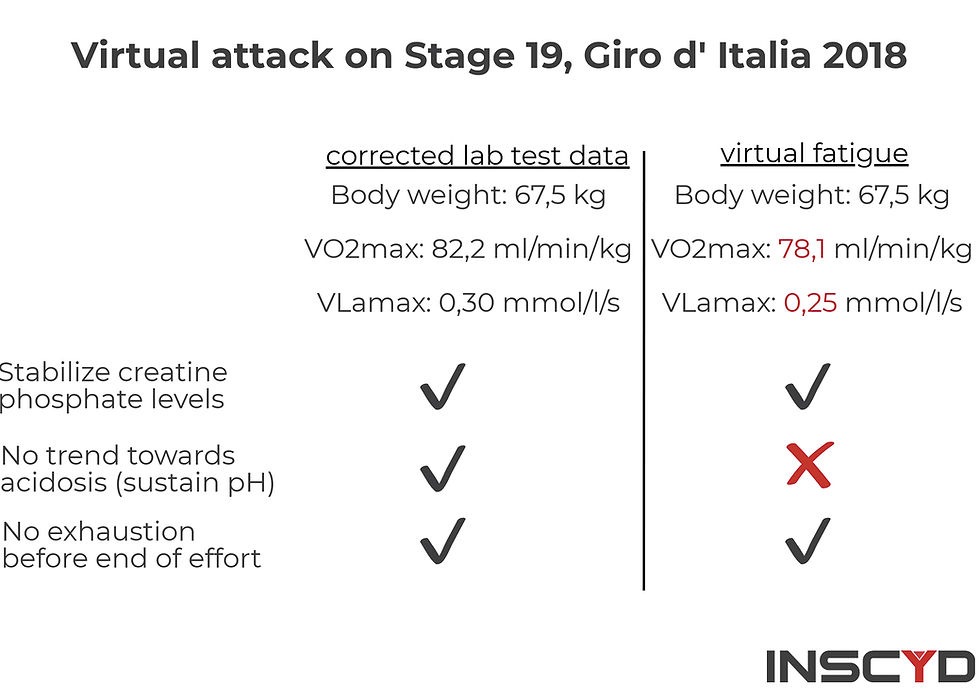
The limits of the possible in the effort of Stage 19: Based on the corrected lab test data (left side) the effort of 11:03 does not lead to exhaustion but could have been sustained for even a longer period of time. Reducing the physiological capacities (right side) by 5% (aerobic system) / 17% (glycolytic system), the effort leads to signs of fatigue but not complete exhaustion.

The limits of the possible staying with Dumoulin during his attacks on Stage 20: Based on the corrected lab test data (left side) the effort of 3:00 is a severe exercise showing several system of fatigue, but not to exhaustion before the end of the effort. Even reducing the physiological capacities (right side) by 5% (aerobic system) / 17% (glycolytic system) would not result in exhaustion before the end of the effort. This shows that countering the attacks from Dumoulin would not have been an issue.
LOOKING FORWARD: WHAT ODDS A GIRO/TOUR DOUBLE?
Froome is being investigated for a test given during last year’s Vuelta a Espana which showed twice the permitted maximum amount of Salbutamol. He may lose his overall win in that race but, because it is a specified substance, is able to keep competing until a final verdict is handed down.
This is why he was able to ride the Giro d’Italia, and the delay in reaching a conclusion in the case is why he believes he will be able to ride the Tour de France.
CyclingTips asked Weber about the possibility of Froome pulling off the first Giro/Tour double since Marco Pantani did it in 1998 — 20 years ago, in a very different era for the sport. Knowing what Weber knows about physiology and what a Grand Tour takes out of a rider’s body, what are the chances Froome will be in peak form for the Tour?
“I can tell you that it is a difficult task to recover from that. You would be tempted to think that maybe it takes him less to recover, because he finished the Giro strong,” he said. “Maybe a guy like Simon Yates would need a much longer time to recover, because he seemed to be at full gas, so to speak, for a longer period.
“So maybe this plays to Froome’s favour. But it is a very difficult task. What it may come down to is if he can play the Tour like how he played it in the Giro. Being left behind in the first week and then gaining back the time…that is a very risky game to play. I think you can’t rely on that.
“I haven’t looked at the stages of the Tour, but I think it might come down to needing to be at 100 percent from the first day to the last day, and this is maybe, in combination with doing the Giro, a very, very difficult task. It all comes down to what his physical condition is now, and what he lost by doing the Giro. But he and the team around him will know much better than me about this.”

Chris Froome (Team Sky) sealed his third consecutive Grand Tour victory in Rome on May 27.
#inscyd #inscydppd #cycletraining #cyclingcoach #cycling performance #coachingworks


Comments